Mikkel Wittenburg Petersen
About
Projects
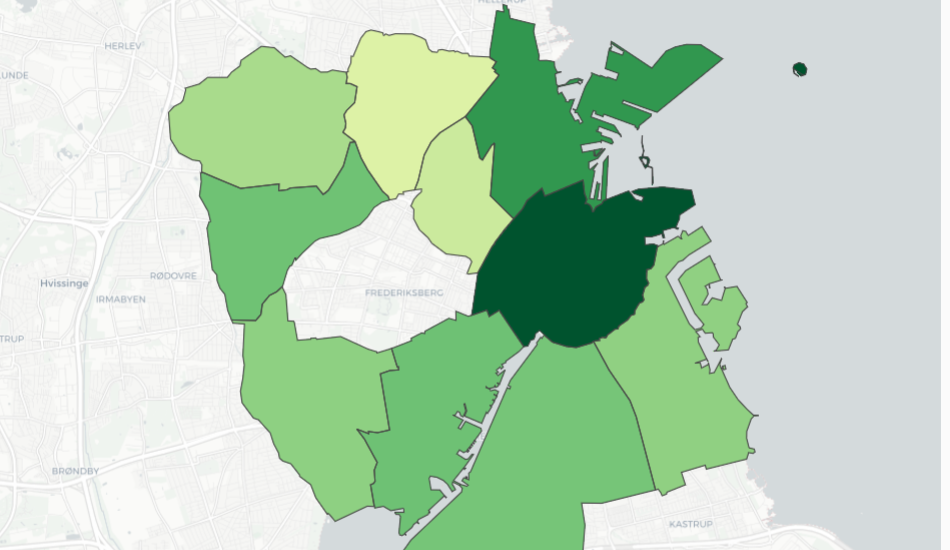
How the average income in the districts of Copenhagen has changed
An interactive map created with the Python modules Dash and Plotly. Data is from the City of Copenhagen Statbank.
View source code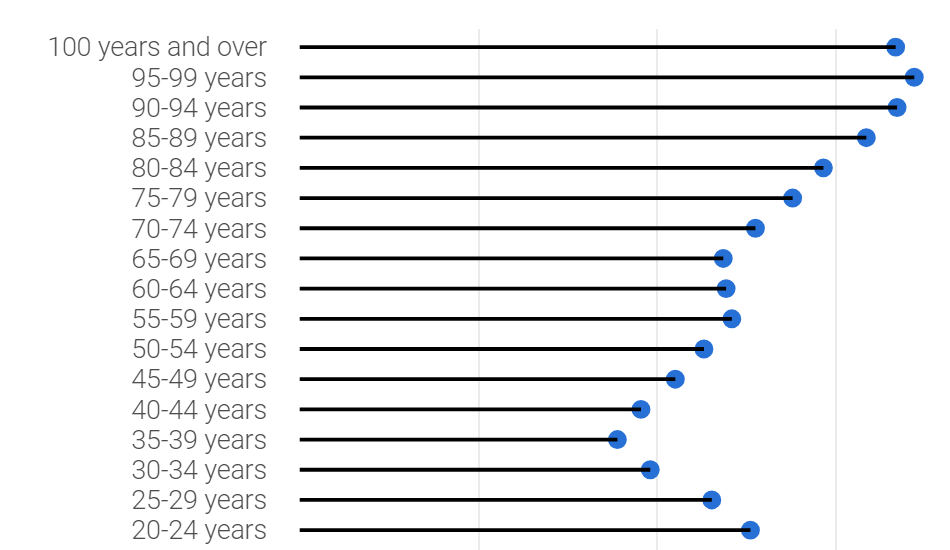
Membership of the National Church in Denmark's largest cities
An interactive dashboard created with the R packages Shiny, ggplot2 and Plotly. Data is from the Statistics Denmark’s API for StatBank using the R package danstat.
View source code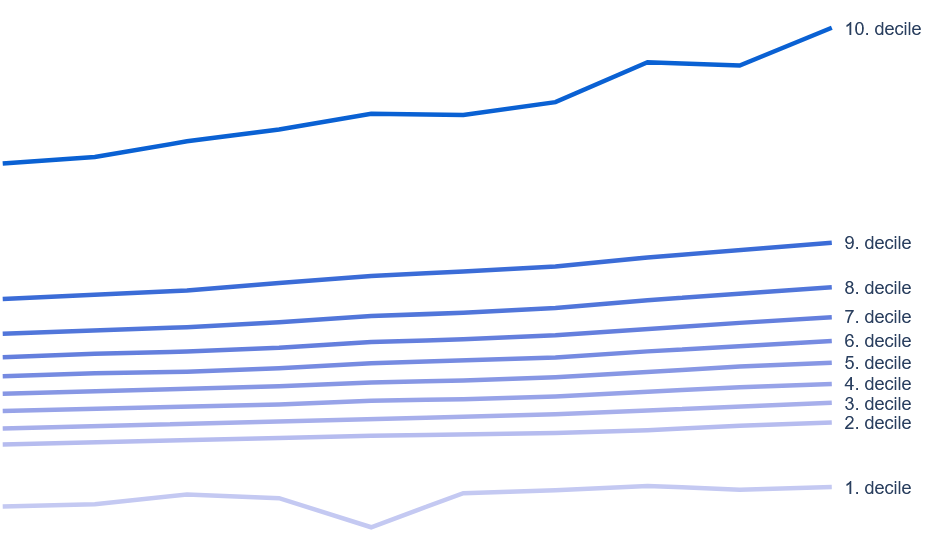
Economic inequality in Danish municipalities
An interactive web page created with the Python modules Streamlit and Plotly. Data is from the Statistics Denmark’s API for StatBank using the requests module.
View source code